Tech Insights through Patents (TIP)
Green Technologies
Stay ahead of the innovation curve with our interactive TIP tool showcasing worldwide technology trends in green technologies. This tool helps innovators understand patenting trends through an easy-to-navigate interface, making patent data more accessible.
Leverage the power of this interactive tool to uncover hidden intelligence and keep abreast of technological advances.

Share Your Feedback on TIP – Green Technologies


For more details on the key highlights and interactive charts, visit the Glossary
Share Your Feedback on TIP – Green Technologies
Help us enhance our insights on Green Technologies by sharing your thoughts and suggestions.
Give Feedback
Get the Latest IP Trends & Insights
Stay updated with expert insights, industry trends, and exclusive events to help you navigate the world of intangible assets.
Tech Insights through Patents (TIP) Glossary
Here is a brief glossary on what the various indicators in TIP’s key highlights and interactive charts may mean for your business.
Indicators in Key Highlights
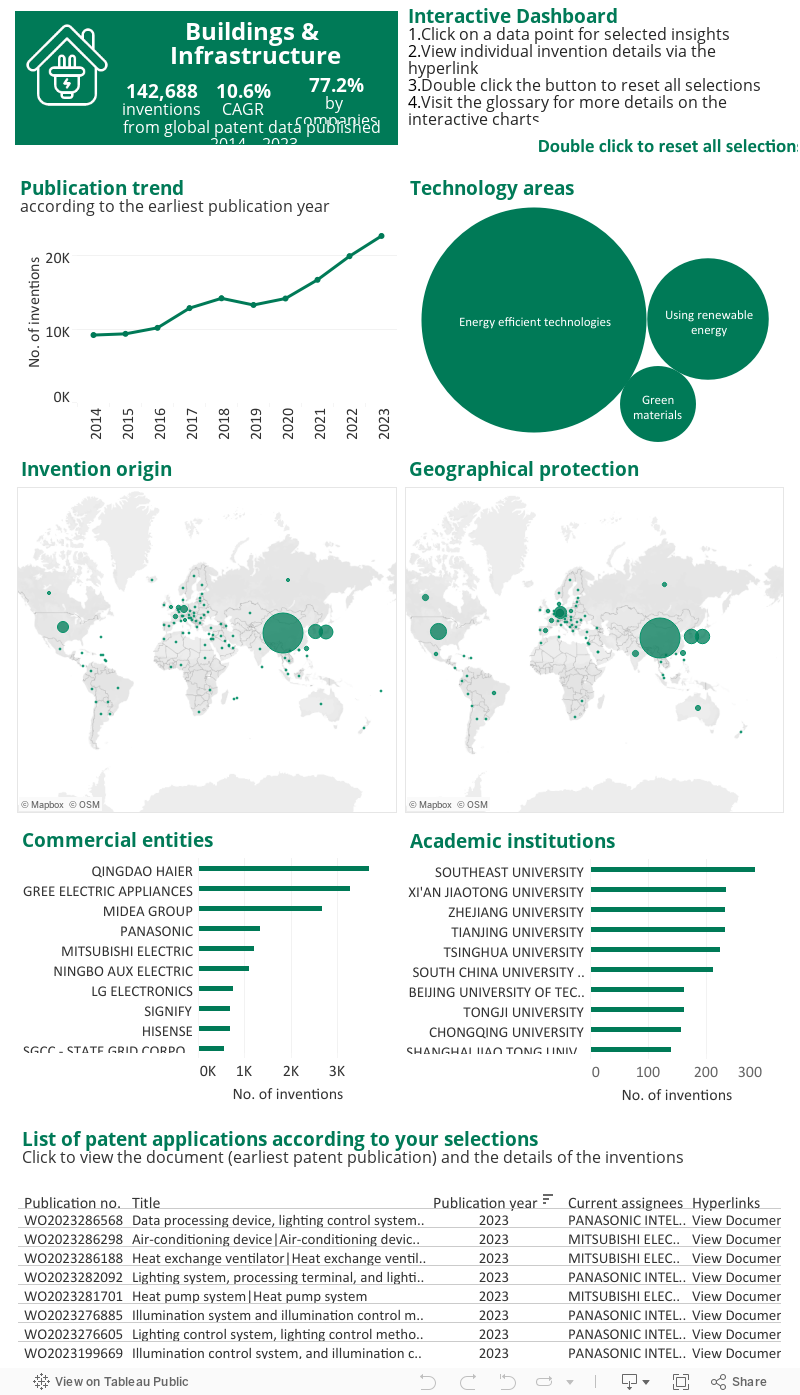
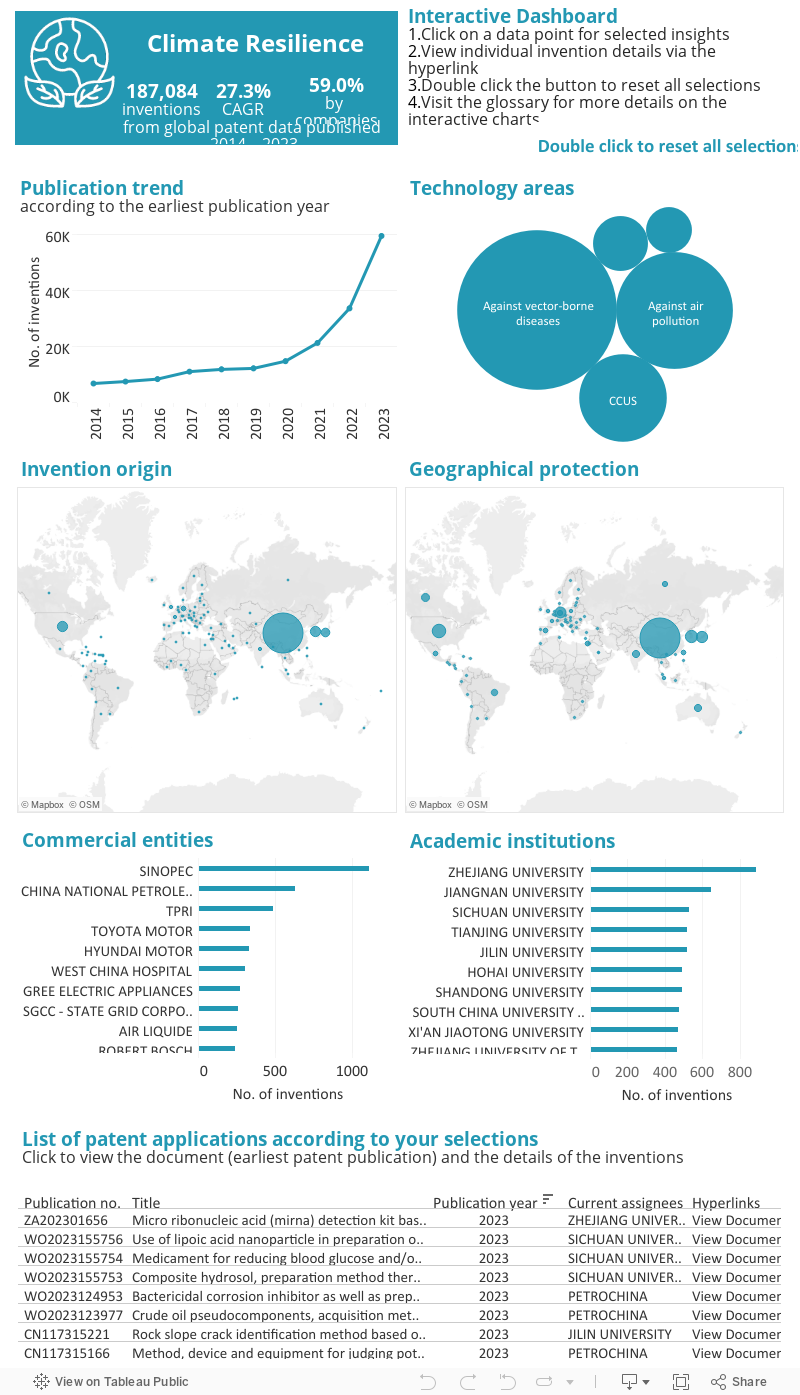
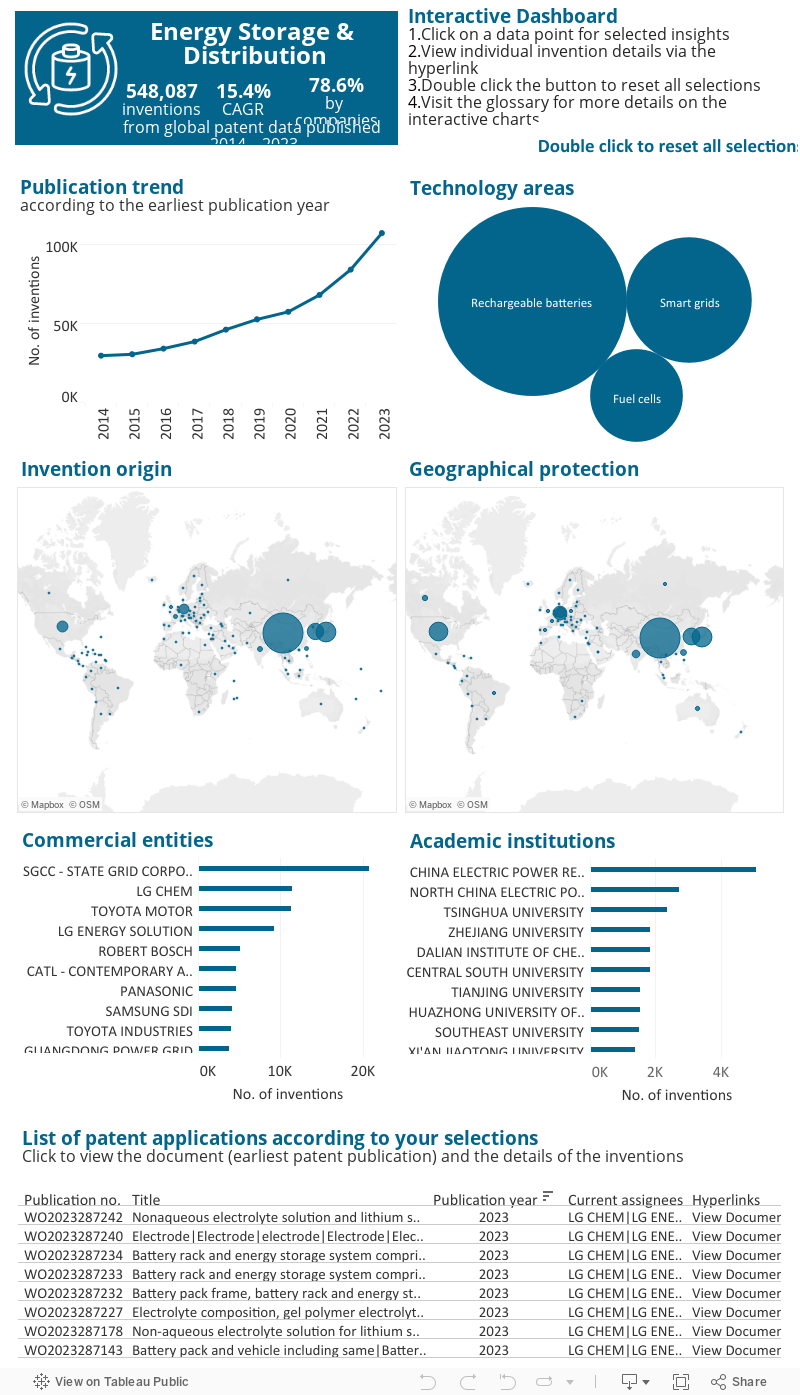
NUMBER OF INVENTIONS
The total number of inventions published globally over a 10-year period shows the level of R&D interest and innovation outcome.
COMPOUND ANNUAL GROWTH RATE (CAGR)
This percentage measures how the R&D interest has evolved over 10 years. A high CAGR indicates that traction has rapidly increased, and vice versa.
NUMBER OF TECHNOLOGY FIELDS
This number (out of 35) shows how widespread the technology is applied across industries.
PERCENTAGE OF INVENTIONS CONTRIBUTED BY COMPANIES, UNIVERSITIES AND RESEARCH INSTITUTES
This measures the commercial and/or non-commercial R&D interests. A high-percentage contribution indicates that basic research still plays an active role in technology development.
Indicators in Interactive Charts
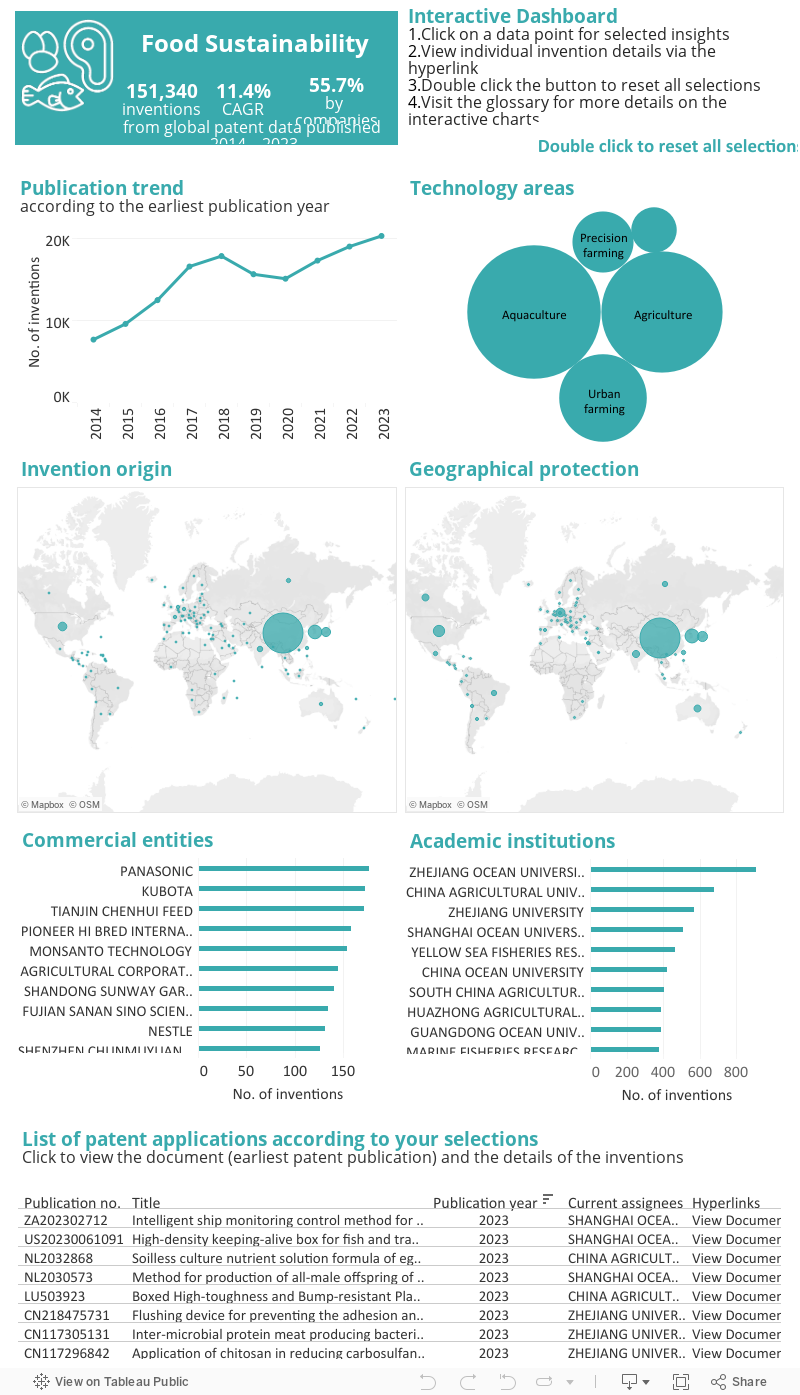
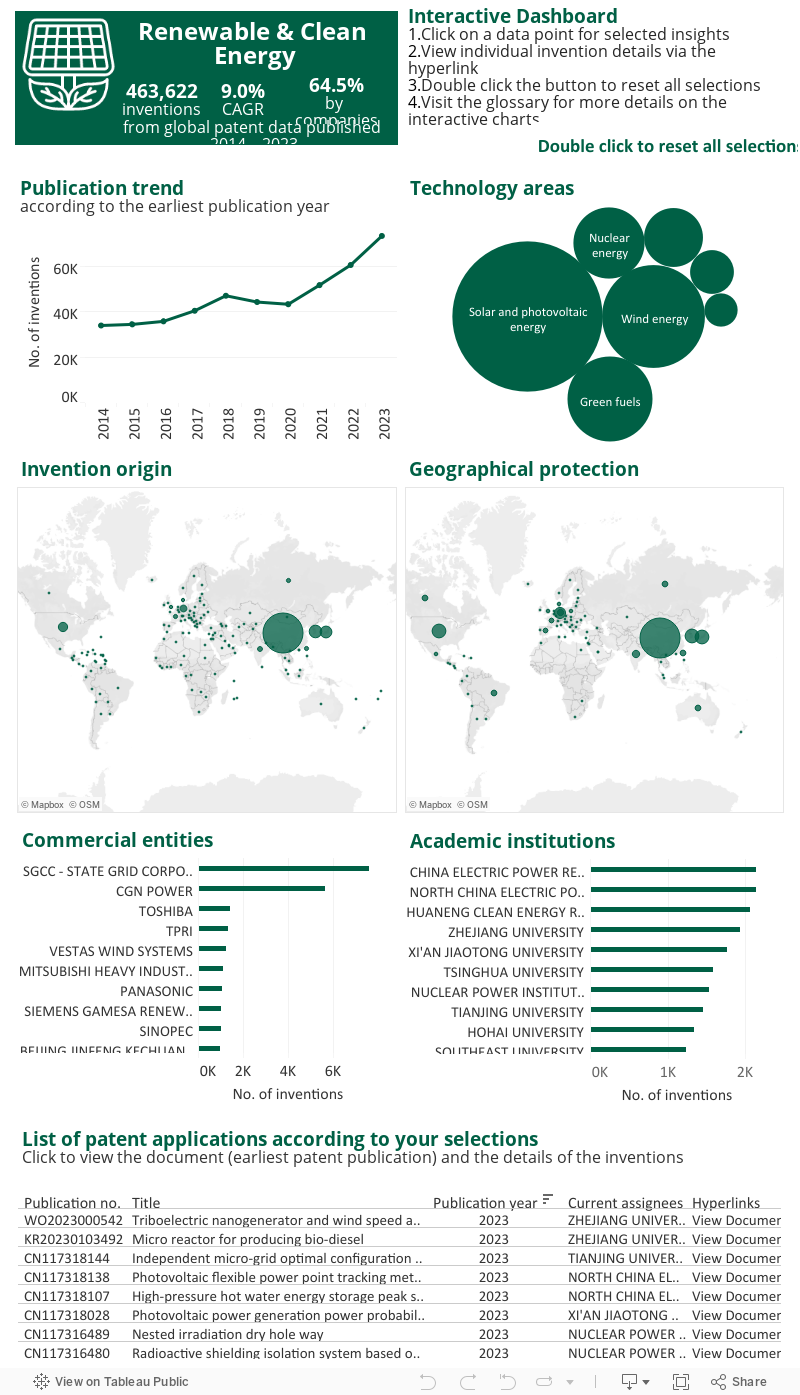
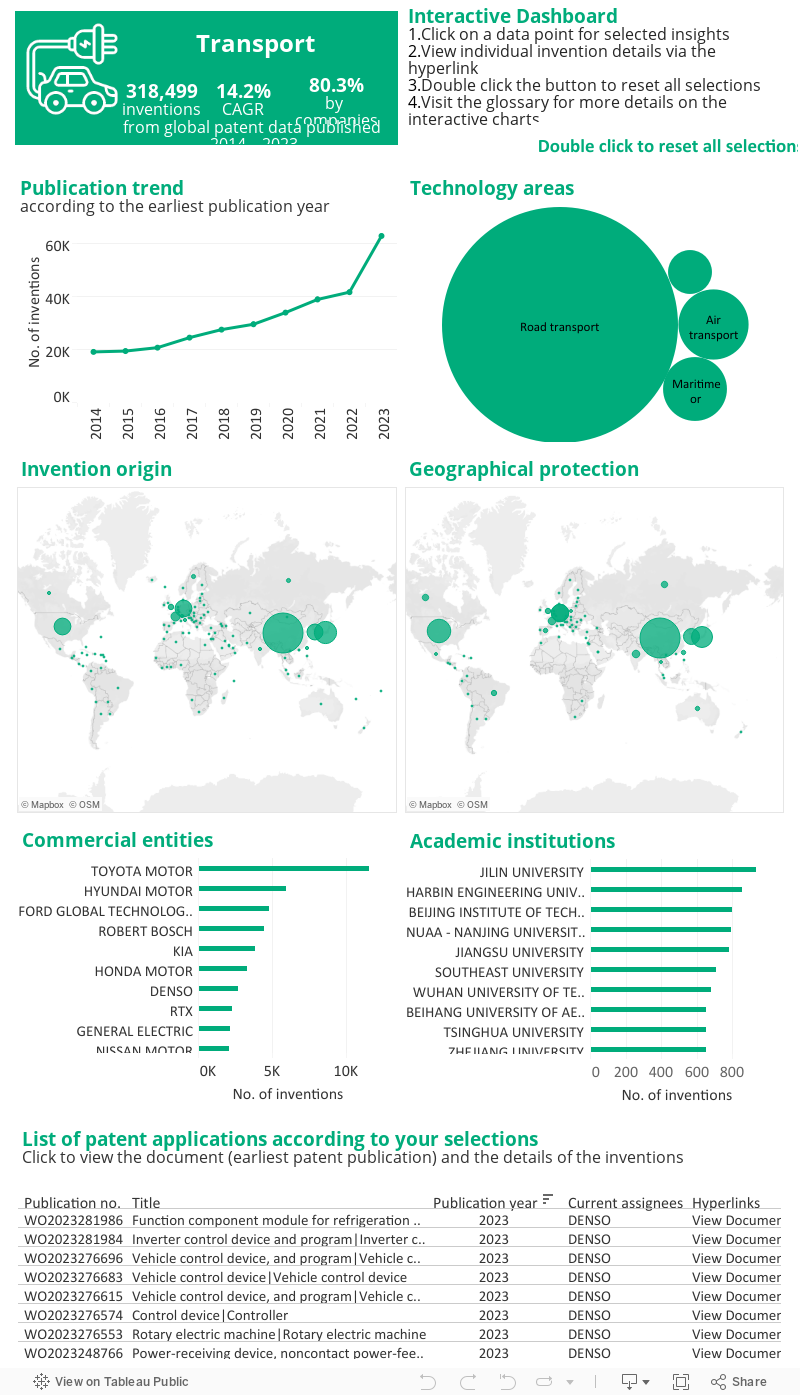
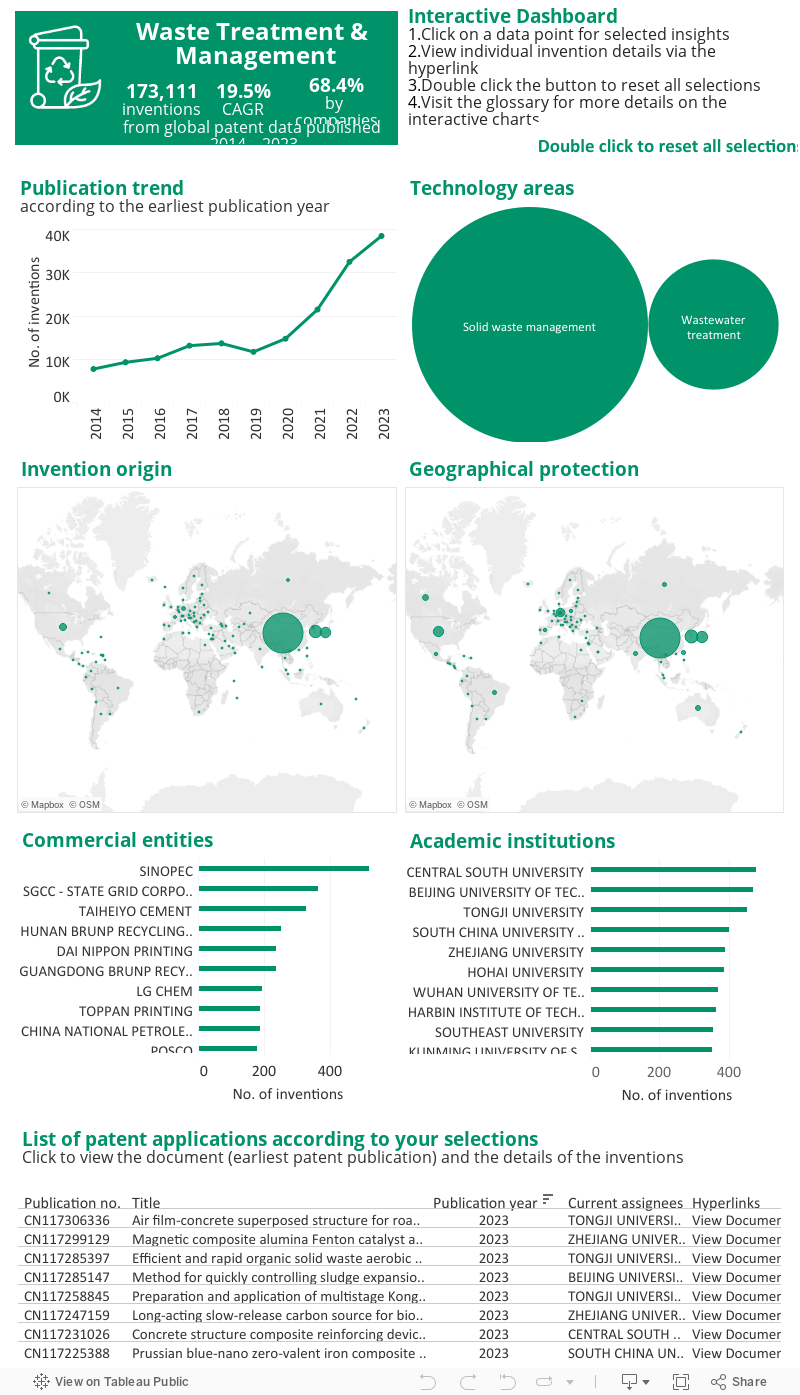
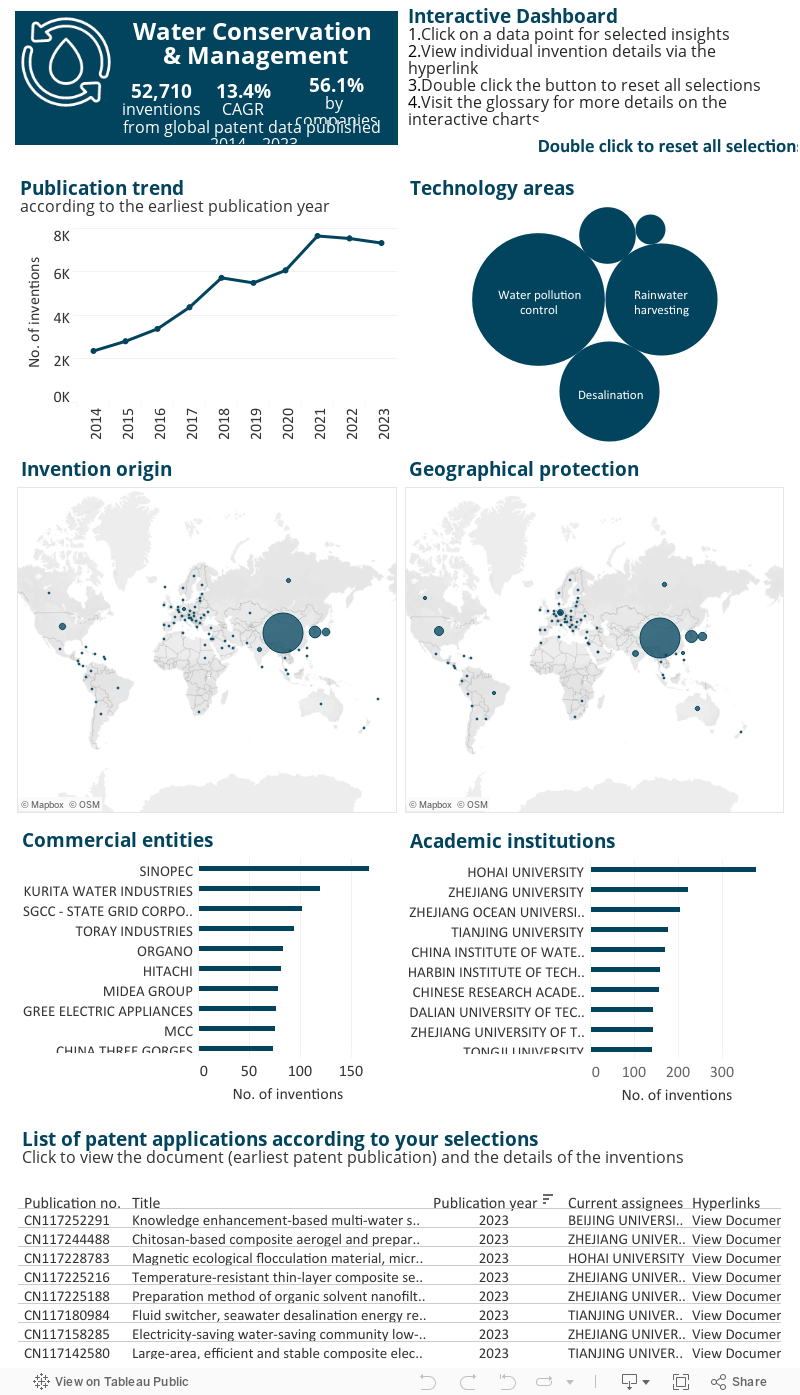
PUBLICATION TREND
Shows the increase or decrease in the number of inventions (as measured by counts of patent families rather than individual patents) over the years. A significant rise in global patent filings may be due to a number of factors such as commercial opportunities, growth potential, government grants and subsidies.
INVENTION ORIGIN
Refers to the country or region where the invention took place. The circles are sized according to the number of inventions originating from the individual country or region.
GEOGRAPHICAL PROTECTION
Represents the territorial protection sought after by the applicant. It is an indication of the applicant’s commercial interest – where it may sell its products/services or where its competitors are operating.
TECHNOLOGY FIELD OF APPLICATIONS
Refers to the mapping of an invention to its technology field of application is performed by matching the International Patent Classification (IPC) codes assigned to the patent families to the 35 technology fields using the IPC technology concordance table developed by the World Intellectual Property Organisation (WIPO).